We usually use this weekly post as an opportunity to examine which trends are emerging on a sector/industry level and highlight ways that active traders can take advantage of them. This week though, we wanted to look at the post-election price action from a different perspective; namely, we're checking in the performance of different stock "factors" or features of the stock themselves.
Academic finance has identified countless stock factors that have offered a "risk premium" (read: higher return than bonds), but there are four that stand out above the rest when it comes to the historical track record: Beta, size, value and momentum. Below, we look at the representative performance of each of those factors to discern what's been working.
Beta
"Beta" is a measure of a stock's volatility in relation to the broader market. In other words, a stock that rises and falls more than the market has a beta greater than 1.0, whereas a stock that is more stable (or at least less correlated with the broader market) will have a beta less than 1.0.
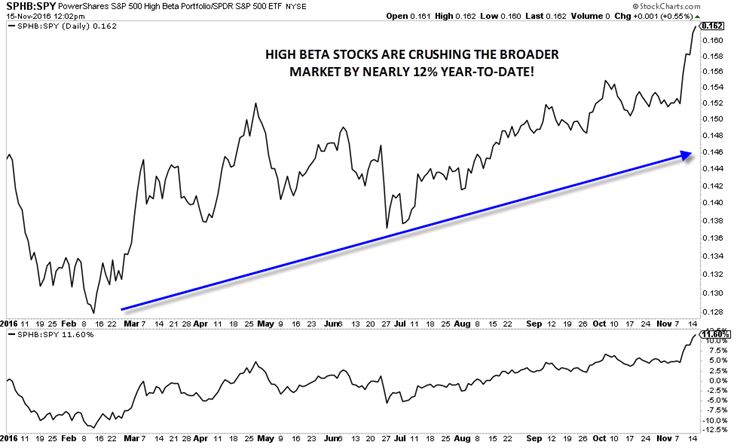
As the ratio chart below shows, high-beta stocks (NYSE:SPHB) had been trending clearly higher against the broader market (NYSE:SPY) through the first ten months of the year and that trend has only accelerated since the election:

Source: Stockcharts.com
High-beta stocks, as defined by the PowerShares ETF, have crushed the broader market by nearly 12% year-to-date. This indicates that investors are confident about the future growth of the stock market (and by extension, the economy) and are willing to take on additional risk in exchange for higher potential profits.
Size
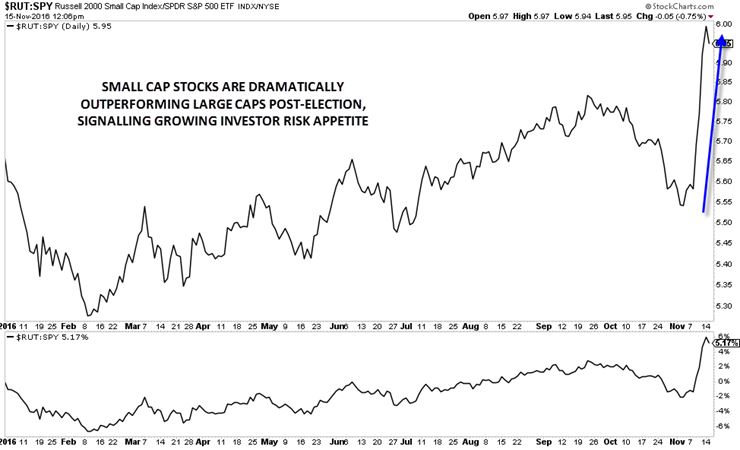
In addition to beta, exposure to smaller-capitalization stocks has historically provided extra return to investors. For the first ten months of the year, this historical tendency hadn't really played out, as small-cap stocks (Russell 2000 index) had been performing roughly in-line with the broader S&P 500 index, which is made up of generally large cap stocks. That's changed dramatically in the week since the US election though, with small-cap stocks now outperforming the S&P 500 by over 5% on the year:

Source: Stockcharts.com
Like the strong performance of high-beta stocks, the surge in the value of small-cap stocks is a "risk-on" behavior that signals investors are bullish on the future prospects for the stock market.
Value
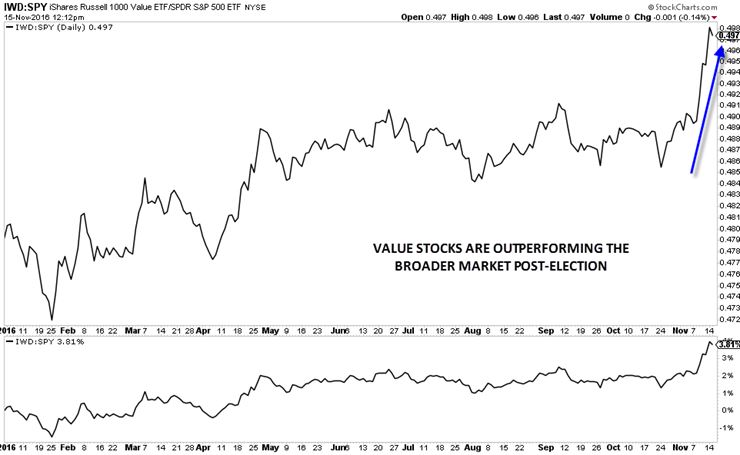
Value stocks are generally defined as stocks that have a low price relative to a measure of fundamental performance, most commonly earnings. As the chart below shows, value stocks (NYSE:IWD) had been essentially keeping pace with the broader market for most of this year, though they have been outperforming in the wake of the US election:

Source: Stockcharts.com
The relative outperformance of value stocks post-election doesn't necessarily have the same risk-on/risk-off interpretation as the beta or size factors, but it does signal that traders may want to focus long trades on outperforming value stocks and short trades on underperforming growth stocks.
Momentum
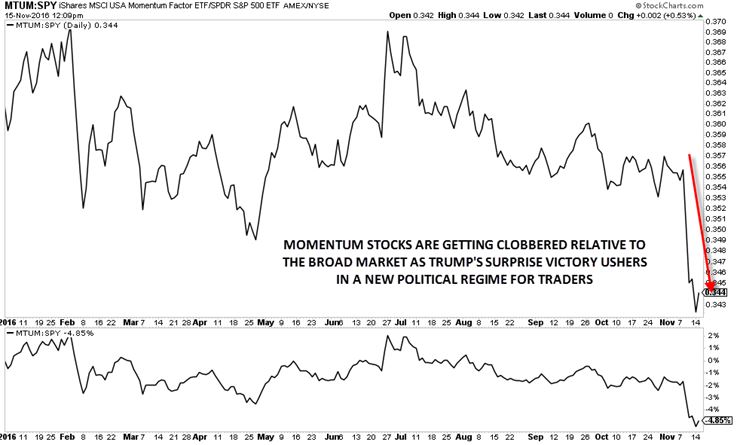
Momentum stocks are simply stocks that have been rising strongly of late. An abundance of academic research shows that stocks that have performed strongly in the recent past (3-12 months) are more likely to outperform in the future, though they are prone to "momentum crashes," where the highest-flying occasionally fall violently. Ahead of the election, the momentum factor (NYSE:MTUM) had been showing fairly neutral performance relative to the broader S&P 500, but Donald Trump's surprising election win has pulled the rug out from under momentum traders:

Source: Stockcharts.com
As of writing, momentum stocks are now underperforming the S&P 500 by nearly 5% year-to-date! This underscores the impact of the massive political regime shift on US markets. Investors who were positioned for a victory by status-quo candidate Hillary Clinton have had to dramatically shift around their portfolio to adapt to the dramatically different policies that president-elect Trump will bring.
Looking ahead, we believe this adjustment process has further to run. This analysis suggests that, in addition to focusing on the sectors poised to benefit under a Trump presidency, readers should also favor buying stocks that have higher betas, smaller market capitalizations, cheap prices relative to fundamentals, and not necessarily worry about past momentum.
